Sunday, July 28, 2013

DJIA and Nasdaq 100

for the week starting 29-Jul-2013
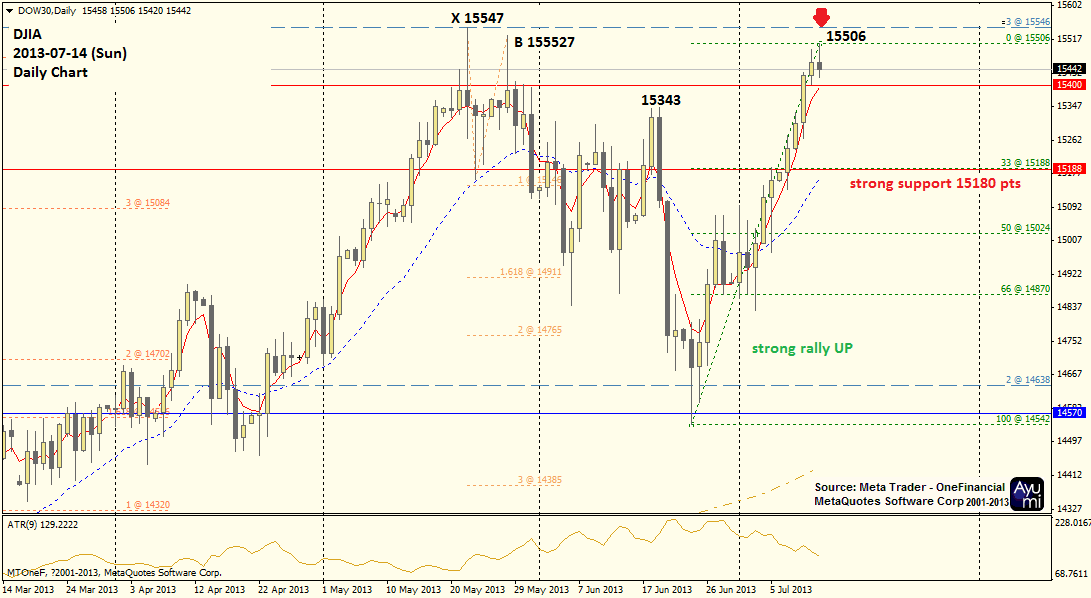
DJIA

Daily Chart
Hola! DJIA break new high, test strong support 15400.
rebounded back to 15554 pts and closed lower this week.


4 hour chart not looking good, a series of lower high, lower low from mid-end of week.


Hourly / Intraday Chart
Market is so alive last Friday.


Intraday trading at overbought level.
await pullback.

Support / Resistance
As per the chart above, this is support (S) / resistance (R) for 1-2 weeks.
R2: 15850
R1: 15620
S1: 15400
S2: 15250

Bullish
Intraday buy 15500 pts, SL 35 ots, TG 15600 or EOD.
Day range diminishing.

July is still a super bull month.
Day range reduced from 180 pts during early July to current 100 pts.

Nasdaq 100

Bullish, higher high, higher low.

R2: 3140
R1: 3090
S1: 3030
S2: 3000

Nasdaq 100 constitutes above EMA20 (D) EMA50 (4H), bullish.

Based on the way Nasdaq 100 trading lately, I would like to play safe.

Extreme Ends, Fibo Range:
Long at 3049, SL 3041, TG 3060 / EOD.
Short at 3085, SL 3093, TG 3060 / EOD.

Cheers
Ayumi

Tuesday, July 23, 2013

DJIA on Tue 23-Jul-2013

I missed the weekly forecast and I wished to update today for DJIA...

DJIA has recorded fresh high last week and I forecast the market to chase higher, but upside range is limited to 15650 pts for the time being.

There's no fresh news to fuse the market with a clear direction but I really hope to see a strong movement up towards 16,000, form a reversal candlestick pattern on day chart and consolidate.

No trade.


Wednesday, July 17, 2013

DJIA on Wed 17-Jul-2013

little joy~

please come down summore~~
Good SL at 15550, moving down.

Forecast still valid.
I maintain my bearish view even though Monday market go 1 point above previous high.


Sunday, July 14, 2013

DJIA and Nasdaq 100

for the week starting 15-July-2013

Am chillin' out at starbucks while beginning my week.
Sunday is a good start except, the aircond blower is getting strong when it is passing 1pm.

I am listening to "If I should Love Again" by Nina, from the Album: Nina feat. the Hits of Barry Manilow.
It's the first time I hear the bass detail via my new toy ~ "BassBuds".

I did quite a number of thing this morning, went to church (although being late), ate the banana chocolate muffin in Starbucks (and contributed 15% to charity), bought a limited edition tumbler, successfully edited a song for my belly-kids (using freeware Audacity).

This morning is just wonderful.

Those who follow my blog knows that I have turned from short to long.
when DJIA break above point B (15350 pts), and Nasdaq 100 has definitely made new high, finally hit 3,070 pts like I mentioned earlier, and gave up earlier.
Related Post:
27-May-2013 when I am convinced Nasdaq 100 gonna make it...
3-June-2013 when I think Nasdaq 100 is not going to tough 3070

Deceived, and made changes too often..
How come our pro-traders are so sure that market is not turning down back then?
There are many questions, and there are many more to learn.

Well, pro-traders, and seasoned traders are smart, and wise.

I am lucky, even though with different market opinion, I did not lose money these two months, instead made some.

DJIA

Weekly Chart:
Bullish
Reaching Higher
Breaking above 1550 soon
and next 15850 pts.


Daily Chart:
Bearish candlestick pattern last Friday might push DJIA down to 15,280 pts, a likely rebound might seen if market were to go towards strong support at 15180 pts.


You find that my point B has not been taken out from the daily chart and the Friday candlestick pattern suggested many resistance at this point.

If market is not going to break 15,550 pts, I am still a strong believer of downturn.
If yes, market break above this level 15,550 pts, then 15,850 pts it goes.

I will prefer to short on Monday.
Initial shadow 15490 pts.
Fibo range 15500 pts
SL 15550 pts
TG 15370 pts

If market continue to fall to 15180 pts (Strong support indicated in daily chart),
and if market show support either 15280 or 15180, I would go long.

If ... market go lower, rebound with convincing pattern (may be Tuesday):
Long 15280 pts
SL 15230 pts
TG 15450 pts.

This is what I forecast for early of the week:


Nasdaq 100

Hit 3070 level (forecast in May 2013).
This is a New high in Nasdaq 100, from the technical chart, this means bullish and it is going to hit  higher.
Next target 3092.

View: Bullish.

If you planted some gung-ho seeds in me, I might want to enter long with initial shadow 3062 pts, but erm...
It is contradicting with my DJIA forecast, and I have no trade preference in this market -- give me an Asahi may be I would do it.

Strong Support 3,020 pts.

Cheers
Ayumi

Thursday, July 11, 2013

DJIA update on Thu 11-Jul-2013

DJIA 4 hour chart

It has break previous high (marked with a curved line)
It is going to go higher towards 15550 pts now.

I abandon short for time being.
 

Sunday, July 7, 2013

Gold on Sun 7-Jul-2013

I don't like this...

Gold has been falling.
And Catching a falling knife, is not fun.

From Weekly Chart, inner wave (blue) has reached 4L wave target.
Bigger downwave (black) target is $1013 - which I don't think this can happen.

I am really HOPING gold can go up.
but I need a convincing reversal candlestick pattern to enter Long.

Gold price is trading below EMA20, EMA50, and EMA200.
STRONG bear.

Stochastic is no where at low.

Monday market is tend to go lower from current price $1222.
Towards $1200 or $1170.

Let's see.

DJIA and Nasdaq 100

for week starting 8-July-2013

Past week is a busy week.
I went north of Malaysia on Sunday (1/7) spent two nights in Penang, then back to KL for 3 days continuous training with a lot of homework (just didn't expect my training to be this intense) and at last on Friday went to Sri Kembangan for a product demo.

This week and the following week will continue to work in two time zones, literally staying awake for whole day.
Software consulting work from 9am - 6pm, dance from 8pm-10pm, traning from 11pm-4am (next day).

I think I can rest from 4am to 7am? Can hardly imagine that.
I think I love my job.

Let's review my past week forecast.
DJIA 4 Hour Chart

Last week, early of the week the forecast went well.
Remember on Thursday, I posted that I intend to enter short when market test 15100 pts again, but if reversal didn't happen, hold it.
So I didn't enter short, I didn't even watch market that hour.
Related post: [DJIA 4-Jul-2013]

A friend from Singapore PaulC left a comment in my FB, remind me to be alert that DJIA might go to 16000 pts before melting.
Well I think I should take precaution of that too.

Let's see what I see from chart and from my Support Resistance + Fibonacci + PowerWave perspective.

Monthly Chart
July candle is bullish, hopefully it stays below 15200-300 pts and close the monthly candle below 14900 pts, it looks healthy this way for bear to breed.

Otherwise my point B will be taken out, I expect market to move higher towards 15500 pts.

Weekly Chart
If I look at the chart from bottom up, recent low at 14540 has fulfilled 1/3 retracement - which means DJIA is set to go higher, towards 16650 pts.

like this:


Daily Chart
Last Friday is an interesting trading day.
it was US Independence day holiday, many observe this holiday and off but market resumed trading towards end of the market day.

It has been falling and I thought: "yeah, its coming!"

But from 30 mins chart, market had a nice fall towards 15000 level, hit EMA200 (30M), rebounded sharply and closed with a positive candle.

Federal Reserves still have strong impact in the US market, positive economic data has been a strong factor to market confidence.

8-July, Monday, I expect market to trade higher towards 15300 pts.
Support 15020 pts.
Resistance 15200 pts.

Am still looking for opportunity to short.

Trade Plan
Intend to:
Short 15220 pts
SL 15280
TG 15040

Long 14960
SL 14900
TG 15140

Nasdaq 100

Not as bullish as Dow.

No Trade.

Thursday, July 4, 2013

DJIA on Thu 4-Jul-13

This week on Dow, so far sideways Ping Pong bias down. And we are coming to Thursday.

Expect some announcements tonight and expect same movements - faster time.

For day time, I think shorting around resistance level 15,000pts can work and let's aim for a candlestick pattern with antenna top. But if it doesn't. Hold your fingers.


- Posted using BlogPress from my iPhone

Tuesday, July 2, 2013

Transaction

I went out for beer with colleagues last night and 4 of us played cards and we played the "lying dices".

It's amazing to see how some people really know how to con the others. Well it's just having fun among friends and colleagues.

During the night, I turned on Interceptor and found US30 (YM or DJIA) has tested 15000 level and stochastic level went high.

And, I placed a market order to short, giving 50 pts stop loss, reminding myself of the day range is 200-250 pts... Market might go higher to 15100 then I will give up shorting.

So i think it's reasonable and justifiable to short.

Order closed just now. Made 71 pts by shorting.

Order ticket:


Side track a bit for my early week activity.

I had fun in Penang island. Had some nice hawker food.

Went to this Sisters' Fried Kueh Teow this morning.


Sisters fried kueh teow.
And we ordered food from other stalls, they are generally good, especially the Penang Hokkien Noodles (red soup is made of prawn), the red drink is nutmeg, u should try nutmeg if you come to Penang.


- Posted using BlogPress from my iPhone