Sunday, October 28, 2012

Weekly Forecast (FX) + Gold


GBP/USD

Daily range : 80 pips

Current: 1.6090

Daily chart: Trading in a downward channel, ding dong up and down towards 1.5850 (EMA200) in 2 weeks time.
Intraday chart: bearish, reckon to return to equilibrium :: shall slide from current 1.6090 to 1.6045, hopefully can reach 1.6020 before posing higher.

Stay out.

USD/JPY

Daily Range: 45 pips

The central bank is expected to cut its growth and price projections at the October 30 policy meeting.
Market is led by fundamental developments - weak external demand, strong yen… how would the next stimulus package help with USD/JPY?  Stay close to news and I prefer to stay out.


EUR/USD

Daily Range: 70 pips

Weekly chart: Sideways, contracting trading range, awaiting breakout.
Daily chart: current support risen up to 1.2890, resistance 1.2990.  Strong support 1.2800, Strong Resistance 1.3090.
Intraday (4H) Chart: market shall continue trading in this flag pattern until Thursday / Friday.

Neutral.  No trade.

XAU/USD

Daily Range: $16
Weekly Chart: Bearish, although with a star candlestick pattern, we need a confirmation if market is going to reverse up and resume up trend.

Personal bias:
We at Ayumi the Novice Trader reckon market to continue trending down from current price $1712 towards $1660, that is -$50.

Daily Chart:
Gold has posted a strong gain last Friday, from low $1700 to $1718 – and this bullish sentiment shall take a breather, retrace to $1709, and challenge $1720 again on Monday.

Trading Plan:
I will hunt for short instead of Long at support…
However, for aggressive trading : I would place a Long trade on Monday near $1709, close EOD or near resistance.
Main objective for the week would be hunting short near resistance $1715-20, target exit 1700.

chart explains far better than words:


Cheers
Ayumi

DJIA and Nasdaq 100


Dim sum breakfast with a group of fun person, help to hang a photo frame on the wall in a friend’s living room (I am not the one hanging, but I do marking and measurements), and laze the whole afternoon – made instant noodles, read news, ate chocolates, took some fresh milk, read magazine, and watch some Taiwanese drama…

Rain was heavy and I can see the rain pour from one side of the city, to the other side.

Having a Sunday like this is really cool, it has been like… 2-3 months I don’t get to rest this way, appreciate.

DJIA and Nasdaq 100 Update for week Starting 29-Oct-2012

DJIA

Market has post another black candle on weekly chart after last week’s confirmation.

While the earnings report is still on the way (more than half has reported their earnings) but I think the economic data which is due to release this week, NFP, is going to be the focus of all traders and investors.

After having the QE3 in force, election, can US create more jobs and reduces jobless rate as per the market forecast?
Crucial Friday.


Strong Support: 12950 pts.
If, DJIA break below this strong support, then it shall head down to TG1 12750. Then 12500 pts.

However, I believe market to sustain above 12950 in this coming week.

Intraday Chart (4H)

Turning Long near Friday low 13004 pts. is preferable - SL 12950 pts.
Rebound shall bring DJIA back to 13200 pts., then trade sideway bias up to test 13300 pts. (last week opening).

Yes, I am bias long in the middle of this bearish trend.  Trade with caution and lets aim for another short after market face rejection around 13300 pts.

Intraday trade for Dow: Long @ 13050 – 13070, SL 13000, TG 13200.

Nasdaq 100

Bearish
Weekly: Bearish
Daily: Bearish – meeting EMA200 support, leading to short term consolidation.
4 Hour: market should rebound in coming week (similar to Dow), and I do hope the rebound could at least bring Nasdaq 100 back to 2698 – 2700 pts.


In coming month (November), lets say market rebounded to 2700 and face hard resistance, we reckon another wave of correction, sending market down south to 2570 pts.

Compare to Dow, Nasdaq 100 is more bearish and I would prefer to Long Dow, than to Long Nasdaq 100.

Cheers
Ayumi

Thursday, October 25, 2012

Transaction

XAU/USD

Short  $1714.63
SL     $1720
TG1   $1702
TG2   $1693


DJIA an Nasdaq 100

On Thu 25-Oct-2012

Nasdaq 100

I feel so like entering long... but not yet.
clue within 30 minutes chart

Trend: bearish, with momentum, strong.
approaching support 2660 but I think should trade lower soon.

2nd clue, 4 hr chart:

may be it still need a little bit of time before we accumulate enough power to reverse.

Lets spot a strong support level from daily chart:

2640 pts, Thursday (today).

DJIA


bearish, consolidation, challenging lower.
likely to hit 13050 and test below 13000 soon.

However, I don't suggest trading long unless we see rejection around 12950.
Those prefer going short, park short order near 13150-177 pts, TG 13000 (less favour).

Cheers
Ayumi


Monday, October 22, 2012

DJIA and Nasdaq 100


For the week starting 22-Oct-2012

World stocks, Commodity and Crude Oil fell on Friday upon fresh global economic concerns, lack of progress on Spanish bailout request.

Gold fell from $1742 region to $1720.80, $20 (more than 1 percent) – the biggest one-day slide in more than 3 months.

DJIA fell from 13550 region to 13343.51 pts., -205.43 pts. (more than 1.5 percent) – erased most of the week’s gains as the earnings from large multinationals underscored.

CBOE Volatility Index (VIX) jumped 13.5 percent to 17.06, highest level since 5th Sep 2012.

Technical forecast

DJIA
Weekly candlestick pattern:
bearish, with confirmation.

Daily candlestick pattern:
bearish

Intraday:
market is approaching the critical support 13300-350 pts., if market closed below 13300, then we shall see the bearish sentiment continue.

After Friday (19/10/2012) plunge, stochastic oscillator, is showing strong oversold and market is likely to come up, take a breath above red blue sea, then continue sinking towards 13200 pts.

This short term up move, might face resistance at 13400, or 13450 pts.

Market is unlikely to revisit 13500 level anymore unless there’re rumors to bring it up.

My trading opinion:
Hunt Short 13400. SL 13450.  TG 13200.

Cheers
Ayumi

Wednesday, October 17, 2012

Gold on Wed 17-Oct-2012


Last few cycle spent 7 candles to rebound and cross $4-$5 above EMA50, and fall.

this round it took 10 candles, and how long would it takes to finally decide to break above EMA50 before coming down again?

Or it would never happen?

I will wait another 4 candles (4 x 4 hours = 16 hours) for retracement, unless market shows a strong reversal pattern in 30 mins or 60 mins chart.

Still, patience.

You are at the same time given more courage

I am going to attend the manager’s conference tomorrow and was reading about Gregory Burns this morning; he is one of the guest speakers of this event.

Things happened these few days – cd player doesn’t work, lost my phone, travelled in and out of the country, lack of sleep, market rebounded but I can’t join the trade although I believe 13300 is the critical support point for DJIA… couple of events has added emotional burden on me, I feel miserable.

I am not good at releasing my emotions onto people, I couldn’t express myself as I think it is unfair to the audience… best thing I could do to myself, is to lock myself in a dark room, recollect the miserable events, and sleep with it. When I have enough of all, I blog.

So, this blog post is a release of my emotions, so I could stand tall and walk again.

I read from Gregory Burns:

“Everyone is imperfect. You might be born into a disabled condition, but you are at the same time given more courage. We should look at what we own ant not things we lack.”


This line inspired me, counting the things I lack – is enough. I have been counting them since 12/10/2012... And I think it’s time to let go.

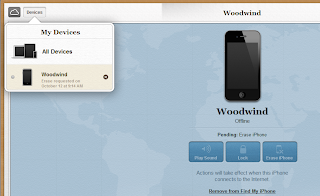
Goodbye to Woodwind, my iPhone4.


Wait for another chance, another week to trade the market.

From 13,300 pts. to 13,550 pts. is 250 pts., Dow30, I miss you once, but I know,
you go and you are bringing your friends and relatives, bring me multiple of 250 pts. of real profit.


Patience, Perseverance
Ayumi


Monday, October 15, 2012

DJIA and Nasdaq 100


Lost a couple of trades, lost my phone last Friday, and confirms that my cd player is broken before weekend.

It was a fun filled weekend, I had a short trip south to Singapore, love people, love Shiraz, Clark Quay, love Shang Palace 香宫.  Love food, love friends, love dancing.

Had too much of good food since last Monday.
Blessed tummy, blessed taste buds.  Thanks!

I reached home by 3:30 am (about 2 hours ago), took a quick bath and I think it is a good idea to review for this coming week, before sunrise.  So, here we go.


For the week starting 15-Oct-2012

Reporting season is heating up, with only 6% of S&P 500 companies having reported, 59% of companies have topped estimates – less than the average beat rate of 67% for the past 4 quarters according to Thomson Reuters data.
Half of companies have beaten on revenue, while a quarter missed profit forecasts.

Trading could be volatile for Nasdaq 100, I have trigged SL and I prefer staying out.

This week we will look ahead to economic data on retail sales, consumer price index (CPI) for September, and existing home sales.

Technical Forecast

DJIA has a losing week and it is hovering between 13350 and 13300, as you know I was hunting for long, and I have entered two long orders, both has been stopped out.
Last week was also a losing week for me.

With the earning reports coming up, I believe this week to be another volatile week.

From the weekly candle, it has confirmed a bearish momentum, but daily chart is showing support – we mentioned the crucial support level 13350 for past 2-3 weeks, and DJIA is already trading around crucial support 13350, breaking below 13300 would confirm bearish trend for next 2 – 3 weeks.

Once 13300 strong support was broken we expect DJIA return to 13000 (the lowest level in early September).

Stay out - unless market shows strength and renounce at 13300 pts., it shall then return to 13500 resistance.
Or else market break below 13300, it will plunge all the way to 13000 pts.

Cheers, I am going to hit the bed,
Ayumi

Sunday, October 7, 2012

DJIA and Nasdaq 100

For the week starting 8-Oct-2012

We mentioned 13350 pts. is the critical level for Dow, closing below 13350 pts. shall confirm bearish sentiment.

Last Monday 1/10/12: DJIA opens at 13447.80 pts., wen to the lowest point 13,425.30 on Tuesday 2/10 and close at 13610.15 pts. on Friday.

Market didn’t turn bearish, and didn’t turn bullish yet –previous easing has push up the stocks and commodity prices.

http://www.cnbc.com/id/49274085

Year 2008, when Fed announced QE in late November, market drives up by 400 pts. in a day and then spurred a month-long rally.
(buying $600 billion MBS)

Year 2010, Fed announces QE2, in November, 3/4 Nov 2010, market drives up 217 pts. in a day, continues to move up higher but tumbled 400 pts. in the following week.
(buying $600 billion Treasury Shares)
Year 2012, Fed announces QE3 in September, 13 Sep 2012, market drives up by 185 pts. in a day
(buying $40 billion of MBS per month, with no limit, open ended = no ending date)

Quantitative Easing (QE) Infinity (rumors called it) has bring market up, but capped below 13700 pts.
What we might want to know is:
1. Whether market has reached the top and
2. Whether market would tumble as investors digest this information
Its hard to tell as the election is on its way and I suspect market shall continue to trade sideways above 13350, testing 13700.

Technical Forecast

I use weekly chart to identify major support resistance and the same is plotted into daily chart.

Daily Chart: Market is supported above 13350, and if market tumbled and closed below 13300, it shall plunge to 13050 pts.


Elections, elections, elections, market is still in a major up trend, and lets say DJIA manage to break up above this overhead resistance level 13700, then it is likely to shoot up to 14000.

It shall take time, but generally we have to be patient to wait for the breakup / breakdown. Market is trading sideways as profit taking is happening.

4 Hour Chart: Bull – Bear Tug of War, market was trading below EMA50 last week of Sep 12, and stayed above EMA50 last week.


We suspect the sideways movement to continue and stay patience for the next big moves.

However, for intraday trade, we favour picking Long near EMA50 (4H) 13500 pts. SL 13450 TG 13650 pts.

Cheers
Ayumi

Monday, October 1, 2012

DJIA and Nasdaq 100

for the week starting 1-Oct-2012

Concerns over Euro zone sovereign debt issues dragged Wall Street market down last week.
Stocks ended lower but posted the best gain since Quarter 3 since 2010.

DJIA slipped 48.84 pts last Friday to close at 13,437.13 pts (-0.36%).

While September is historically the worst performing months for stocks, DJIA rallied 2.7% this month, logging the third largest gain in 2012.

For the quarter DJIA posted robust gains of 4.32%.

Generally traders are cautious about this quarter (October 1st is here!) – with the elections and fiscal cliff coming up, and we expect some profit taking to happen during next couple of months.

Technical Analysis

Looking at the weekly chart we might observed that DJIA has posted a bearish candlestick pattern, and DJIA is trading at a crucial level – breaking below 13350 pts shall confirm the bearish sentiment in daily chart which sets the new trend for coming 2 weeks.

4 Hour chart has signals a bearish sentiments and market is currently resisted below 13500 pts (EMA50, 4H), Support 13350 pts.

We suggest to stay out or to short when market try to pierce above 13500 pts but failed.