
Monday, November 26, 2012
DJIA and Nasdaq 100
Good day traders, apologies! I had 2 days intensive workshop with an Argentinian dancer and was busy busy for the weekend!
My home internet is down, so I am taking my rest hour to post a quick update.
DJIA and Nasdaq 100 for week starting 26 Nov 2012
Technical Analysis
DJIA
Weekly candle: bullish
Daily Candle: bullish
Intraday: bullish
Last Thursday market formed a bullish candlestick pattern making a breakout to the upside.
Reckon market to continue bullish sentiment today to hit 13050 pts.
Aggressive Long entry with intial shadow, 34 pts from opening price (12964 pts), equivalent to 12930 pts, SL 30 pts away, TG 90 pts away or if you are patient, 13050 pts.
Nasdaq 100
Weekly candle: bullish
Daily candle: bullish
Intraday: bullish
Thanks giving, turkey… ^_^ presents and celebration.
Market almost reached our target 2640 last week, pointing to high of 2639 pts.
Market is currently trading below EMA200, which is also a long term resistance line. Unlike DJIA, Nasdaq 100 recovery is fast, and it has made a come back of more than 2/3 fibonacci retracement - I prefer to stay out.
Cheers
Ayumi
Monday, November 19, 2012
DJIA and Nasdaq 100
for the week starting 19-Nov-2012
DJIA
Last Friday, DJIA has posted a reversal candlestick pattern on daily chart, posting a low of 12470 pts.
We identify 12500 level as current support and reckon market to consolidate this week between 12500 – 12850 pts and hopefully market could retrace back to 13050 region in December before the bear take control again.
Market is doing retracement up but the major trend is still bearish, I prefer to stay out.
Nasdaq 100
Similar to Dow, market has hit 3L 2523 pts and formed new low at 2493 pts, reckon market to consolidate bias up towards 2560 pts, and hopefully return to 2600 pts before the next fall take place in December.
Nasdaq 100 is trading as 2540, Daily Trading hunt Long near support 2535 pts, TG 2560 or close EOD.
Thursday, November 15, 2012
Updates on Thu 15 Nov 2012
I am going to get the song "Spring" choreographed!
These songs were from Karim Nagi latest album "Arabized", very cool crossovers.
FOMC
Minutes
Bloomberg Video
DJIA
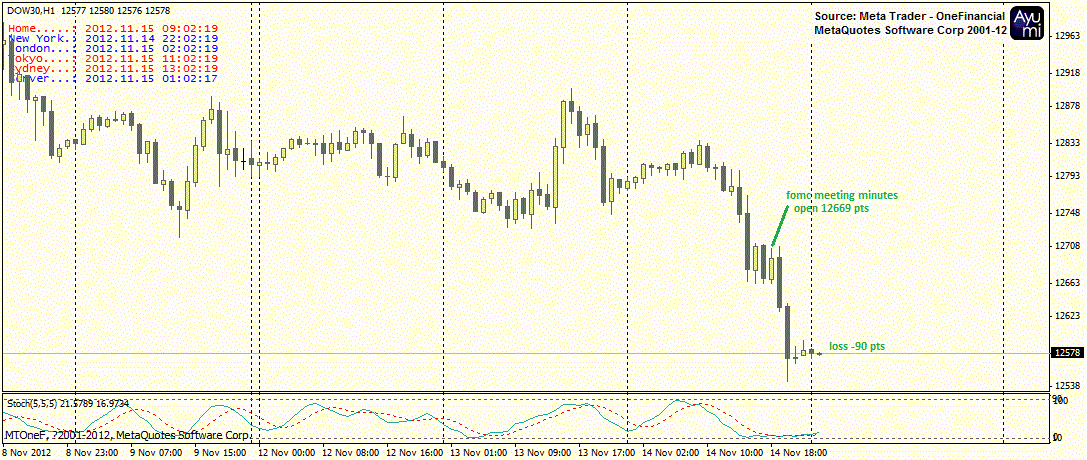
My long trade on Nasdaq100 has triggered SL immediately at the following hour.

Forecast market to continue extension to 3L at 12,400 pts
Check DJIA daily chart:
Strong support at 12450 pts, so if we get an opportunity to short, I may exit around 12400 - 450 pts.

Nasdaq 100
Last trading at 2530, not much room to reach target, target 2523, previous support 2522.

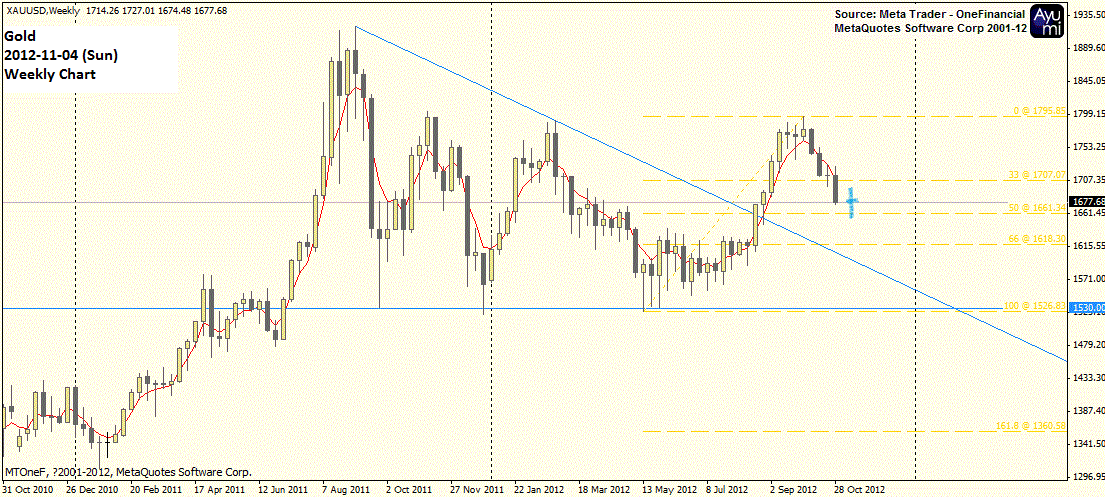
Gold
Weekly Chart
With the bullish candlestick pattern last week, I reckon market to head up, although I am not that convinced as Gold didn't reach 50% retracement level to $1661.
Daily Chart
Gold has posted a handsome reversal when it touches EMA200, as u know I am not convinced, but if market were to continue bullish sentiments, i take 1:1 target price near $1784.

Intraday Chart
Same support were seen in 4H chart, there are a few inner wave plotted.

breaking down to $1705, breaking up to complete 1:1 and reach $1784.
Monday, November 12, 2012
DJIA and Nasdaq 100
for week Starting 12-Nov-2012
Economic Data release: US Retail Sales Report (Nov 14), FOMC Meeting Minutes (Nov 14)
Short-term effects of super storm Sandy, longer-term fears about and consequences of "fiscal cliff" will make U.S. economy unstable, tough to predict
DJIA edged up 4.07 pts. last Friday, to 12,815.39 pts. at the close, Nasdaq 100 gained 9.29 pts. to 2904.87 at the close. For the week, DJIA fell 2.1% and Nasdaq 100 lost 2.6%.
News are about election, post election sell off, then fiscal cliff - the agreement on spending cuts and tax increases that are due to kick in early 2013. There is not election to distract us, and fiscal cliff fears, Sandy aftermath may send market lower in coming weeks.
Ever since we mentioned here that DJIA weekly chart has confirmed the bearish candlestick pattern (related post here)
Oct 1 : http://ayumi216.blogspot.com/2012/10/djia-and-nasdaq-100.html
Oct 22 : http://ayumi216.blogspot.com/2012/10/djia-and-nasdaq-100_22.html
Market has posted series of black candle on daily chart and has reached my target 12800 with a slightly longer tail on weekly chart.

Daily Chart:
Friday candlestick pattern may suggest the beginning of retracement in this bearish market.
Technically, Market shall return to 13150 pts. (also EMA20) – with the fundamental woes, we might observe the immediate resistance at 13000 (1/3 retracement level, also EMA50 in 4 hour chart).
My trading preference is to go long, at initial shadow, and close EOD.
Daily Trading setup (initial shadow : White shadow 3 pts.) entry could be around 12825 pts., SL 12775, TG 13000 or close EOD.

Nasdaq 100
Similar to Dow, we expect market to found support around 2560 pts. (2/3 Fibonacci retracement level from 3June low - 16Sep high).
Resistance 2640 pts., Strong resistance 2660 pts.
Daily Trading with initial shadow – Long 2584 SL 2579, TG 2620 or close EOD.

Monday, November 5, 2012
Gold on Week Starting 5-Nov-2012
Gold
Market has came down and testing EMA200 on Daily chart, looking at last Friday’s candle, today might be a doji candle signaling short term rebound.
Reckon market to form a doji candlestick pattern on weekly chart, and a white candle next week around $1730-1734.
This week on Gold I will be hunting Long, near $1660 levels.

Resistance : 1700, 1709 (EMA 50) if cannot break above then downward pressure shall resume, to $1618-1620 maybe?
Resistance: 1734 if market break above 1710 convincingly.
DJIA and Nasdaq 100
Forum is not available… I will resume my weekly posting when forum is accessible.
Went to Southgate, KL, on Sunday morning and danced for 3 hours learning fan veil. Flip, flip, flip! When the workshop is over, I can only see my fingers shivering - been holding a fan with 1.8 meters of silk material, flip them in the air, turn and dance.
They look graceful, and dancers need time to develop the right grace – holding the fan the right angle, holding them the right direction (forward or back of our hands), keeping them above the ground, and keep our body still.
Tired, but glad I learned this after 4 years.
DJIA and Nasdaq 100 Update for week Starting 5-Nov-2012
DJIA
Last week markets were closed Monday Tuesday marking the first two-day weather-related shutdown since 1888. Sandy the Hurricane destroy businesses, households, and critical infrastructure –might be the clue to next market direction.
US employers hired more than forecast (123k) in October 2012 – payroll expanded by 171,000 following 148,000 gain in September. Unemployment rate rose from 7.8% to 7.9%. Thomson Reuters / University of Michigan consumer sentiment index rose last month to the highest level in 5 years (since before recession).
Election next week Tuesday-Wednesday, trade or not trade?
My opinion: Fundamentals is the underlying force of market direction, technical forecast could forecast price based on historical, pattern, support, resistance and time… when in doubt, stay out.
Technical Analysis
Market settle at 13093.16 pts last Friday (-139.46 pts), posted another black doji on Weekly Chart.
(1) could be another long body black candle down.
(2) Go down to test 13000 support, rebound, and trade higher within these two weeks’ trading range capped below 13,3580 pts.
Daily Chart:
Market tested 13,000 pts last week, this is also EMA200 on Daily chart, after Friday’s black candle, we expect market to test this support again, if market came down but didn’t revisit 13000, we shall have a nice upwave. Otherwise, once it fall to 12950, all the way to 12800 pts.

4 Hour Chart:

Market is trading around EMA50 support which a rebound is likely after testing 12992 (red horizontal line).
To be precise, market should rebound before touching 12992, and it will have the potential to reverse up immediately.
However, if market break below 12992 pts, then we forecast market to fall towards 12800 level.
Personally I prefer market to form new low, but above 12992 pts and start to rebound up towards tg1 13350, then tg2 13530 pts.
Nasdaq 100
I was fortunate to take profit below 2700 before market had a big hit last Friday.
From weekly chart, market has retraced 66% from recent upwave since June 2012.
2630-2640 is a good support level if market were to perform similar to DJIA.
Strong Support 25/10/12 (2611 pts) should not be broken, and if market rebound before testing 2630 – 2640 pts, we could expect market to revisit 2700, then 2750 pts.
Lets say market break below 2640 pts, and break below 2611, we could expect support near 2585 pts.
Cheers
Ayumi
Subscribe to:
Posts (Atom)